
Single zero vs double zero roulette: compare the math
Compare 37- and 38-pocket roulette using the same stake and standard payout, with worked examples and explicit rule limitations.
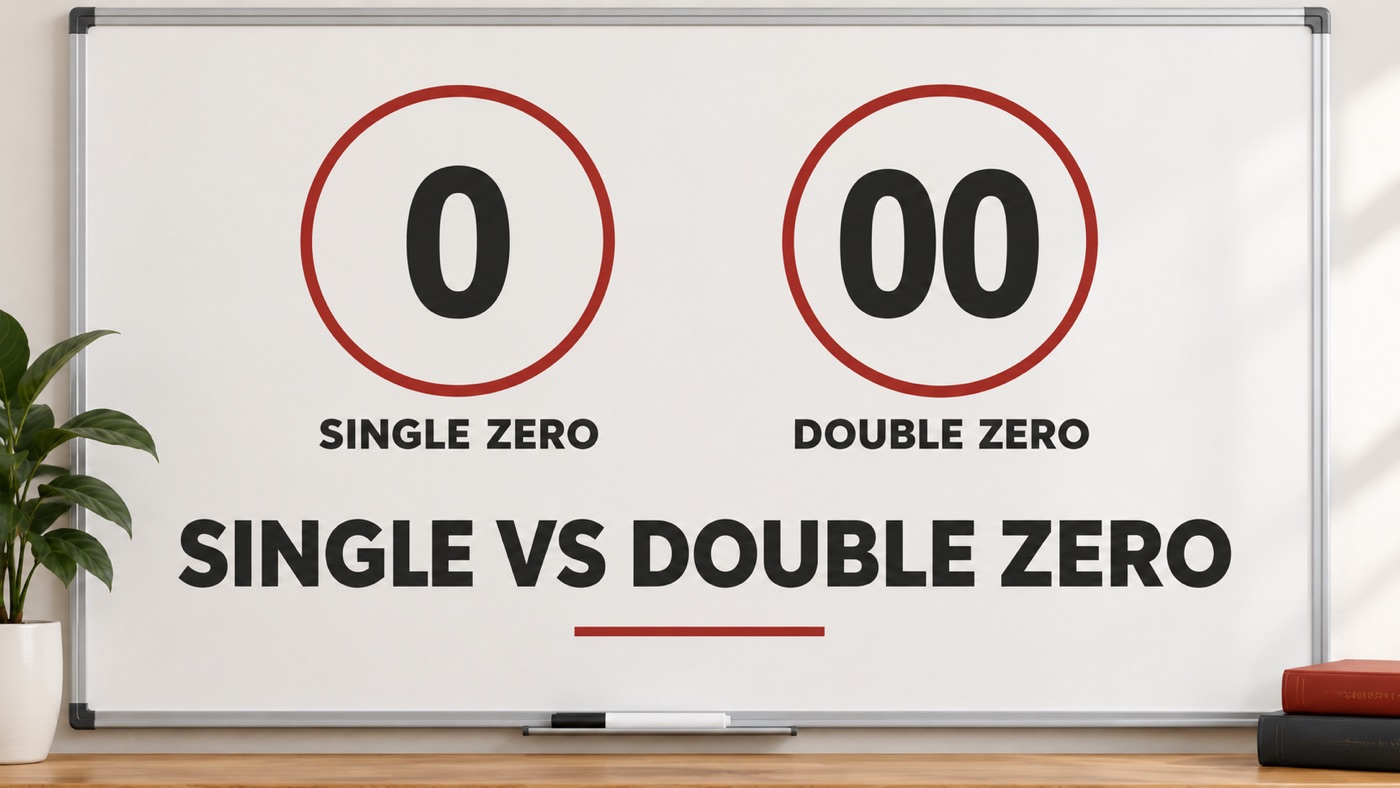
Count pockets before comparing labels
A single-zero roulette wheel has 37 pockets: the numbers 1 through 36 and one zero. A double-zero wheel adds 00 for 38 pockets. Loto-Québec's published rules describe both configurations; the Nevada Live Roulette document describes a single-zero game. The calculations here compare those pocket counts with equally likely outcomes and the same standard net payouts.
“European” and “American” are common labels, but a name or a player's location is not enough to establish the rules of a particular product. Check the wheel, paytable and treatment of zero before using a numerical comparison. This guide does not evaluate an operator, licensing status or game integrity.
A straight-up bet shows the difference
For one selected number, the chance of winning is 1/37, approximately 2.7027%, on the single-zero model. It is 1/38, approximately 2.6316%, on the double-zero model. Both examples pay 35:1 net profit. A $10 win earns $350 profit and returns $360 including the stake; a loss costs $10.
Expected net per dollar on 37 pockets is (1/37 × 35) − 36/37 = −1/37. On 38 pockets it is (1/38 × 35) − 37/38 = −2/38. The house edges are therefore approximately 2.7027% and 5.2632%. This is a comparison of average modeled return, not a claim that the lower-edge wheel wins in a particular session.
Even-money bets reach the same expected edge
A red bet covers 18 pockets. In this comparison, zero and double zero both lose an outside bet. The single-zero expected net is (18 − 19)/37 = −1/37. The double-zero expected net is (18 − 20)/38 = −2/38. The red-bet win probabilities, however, are approximately 48.6486% and 47.3684%, much higher than those for a straight-up number.
The seven groups in our standard payout chart share the same expected edge within these models. Equal edge does not mean equal volatility or identical chances of ending ahead. Bet coverage, payout, number of rounds and stake allocation still affect the distribution of possible session results.
Compare total action, not just starting balance
Suppose a hypothetical session places 100 fixed $10 bets, giving $1,000 of total action. Expected loss is $1,000/37, approximately $27.03, on the single-zero model. It is $2,000/38, approximately $52.63, on the double-zero model. Their difference is about $25.60. A starting balance alone does not identify that total action: money returned by wins may be staked again.
You can reproduce these examples with the roulette calculator. Choose the wheel and a standard bet, then enter $10 and 100 independent rounds. The expected result is an average over repeated modeled sessions, so it can be a fractional dollar even when one real session has a discrete outcome.
Know where this comparison stops
The double-zero five-number bet, side bets and multipliers need a separate model. Special zero rules can also change even-money returns. Do not apply the standard percentages to a game merely because it has the same wheel layout. Use the published paytable and specific loss treatment, and keep expected loss separate from any promise about future winnings.
Sources and checks
- Nevada Gaming Control Board: published Live Roulette rules and paytable · Checked 2026-10-02
- Loto-Québec: roulette game rules · Checked 2026-10-02