
RTP vs house edge: theoretical averages and session results
Understand when RTP and house edge are complements, how observed return differs from a theoretical model, and why equal averages can hide different outcomes.
Define the return before comparing percentages
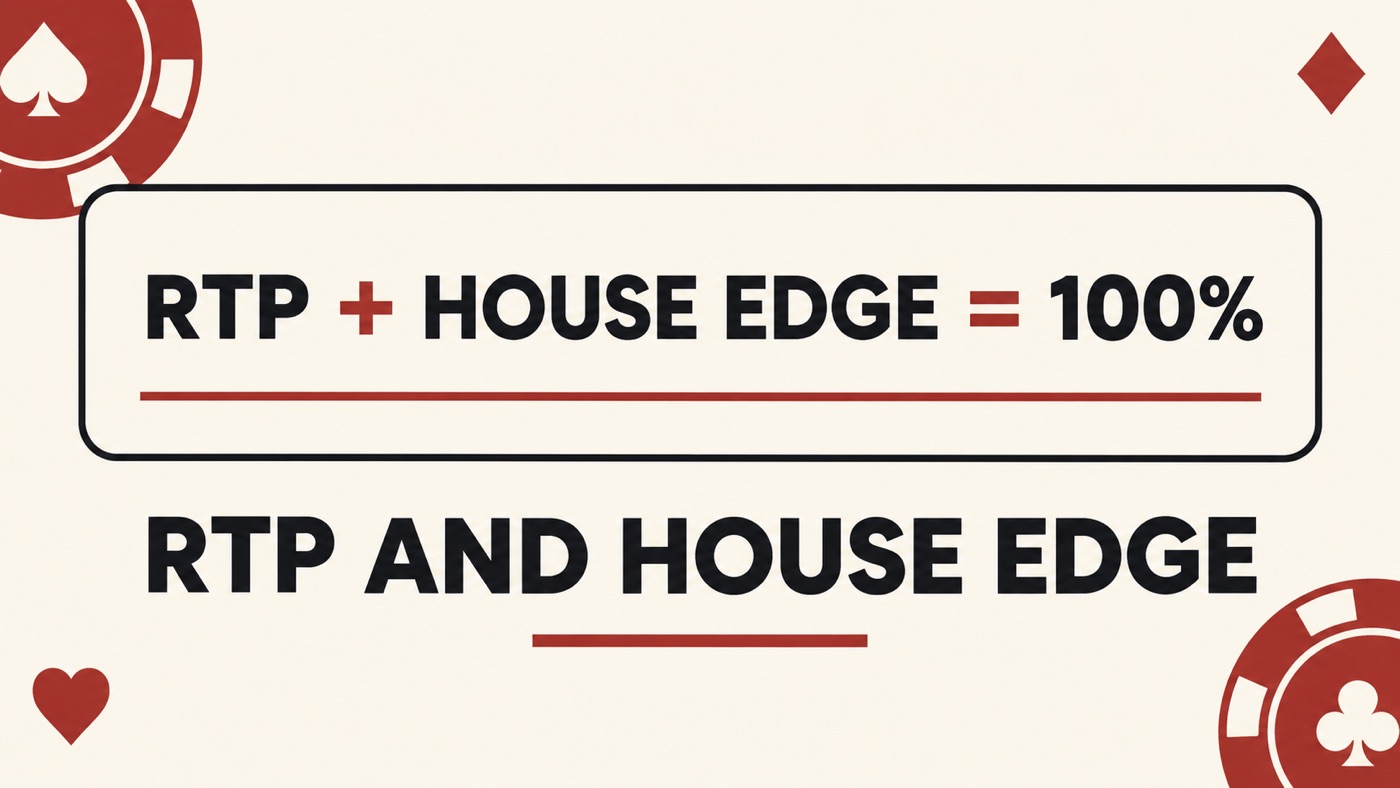
Theoretical return to player, or RTP, expresses expected money returned divided by money staked under a specified game model. Return here includes any stake returned with a win. House edge expresses expected net loss divided by money staked. When both refer to the same rules, stake unit and complete set of outcomes, they are complements: house edge = 1 − theoretical RTP.
The UK Gambling Commission explains RTP as an average across many plays and distinguishes that number from what a short session receives. We use its guidance for the technical explanation. It is UK guidance, not a statement of US licensing requirements, legal availability or a required payout percentage.
Derive both numbers from one bet
Take an ideal single-zero roulette straight-up bet at a 35:1 net payout. With a $1 stake, a win returns $36 including stake and a loss returns zero. The probabilities are 1/37 and 36/37. Expected gross return is (1/37 × $36) + (36/37 × $0) = $36/37, giving theoretical RTP of approximately 97.2973%.
Expected net result is $36/37 minus the $1 stake, or −$1/37. House edge is therefore 1/37, approximately 2.7027%. Adding those two percentages gives 100%, apart from rounding. If someone uses net profit alone as the “return” input, they are calculating a different quantity and the complement relationship no longer applies as stated.
Observed RTP describes the recorded sample
For a hypothetical sample with $200 in total stakes and $186 in total gross returns, observed RTP is $186 ÷ $200 = 93%. That ratio describes those recorded plays. It does not prove that the game's theoretical RTP is 93%, nor does it imply that future plays must repay the difference.
Use total action rather than starting balance in the denominator. If returned money is staked again, it adds another stake to turnover. Record all outcomes on the same gross-return convention and specify the period. The recorded-return ratio above is our own arithmetic. The regulator's monitoring guidance explains why the interpretation of observed results depends on sample size and game volatility.
The same expected return can hide different outcomes
Consider two invented one-dollar models. Model A returns $1 with probability 95% and zero with probability 5%. Model B returns $19 with probability 5% and zero with probability 95%. Both have expected gross return of $0.95 and a 5% edge. In Model A, a nonzero return only restores the stake. In Model B, a nonzero return earns $18 net profit.
The variance of net return is 0.0475 in Model A and 17.1475 in Model B, in squared dollars. These are deliberately simple mathematical examples, not descriptions of real games. They show why a shared RTP does not determine win frequency, volatility or the chance of finishing a session ahead.
Use each figure for its actual purpose
The expected-loss guide relates house edge to total action. The roulette calculator separates win probability, winning return and expected net result. Keep the rules and assumptions attached to every percentage. An average over modeled repeated play is not a promise to recover losses or a prediction of the next round.
Sources and checks
- UK Gambling Commission: return to player and short-session limitations · Checked 2026-10-05
- UK Gambling Commission: sample size, volatility and observed RTP monitoring · Checked 2026-10-05
- Nevada Gaming Control Board: published Live Roulette rules and paytable · Checked 2026-10-05