
New York mobile sports wagering: handle and GGR
April–August 2026 official monthly data, exact dollar values and the difference between wagering volume and revenue.
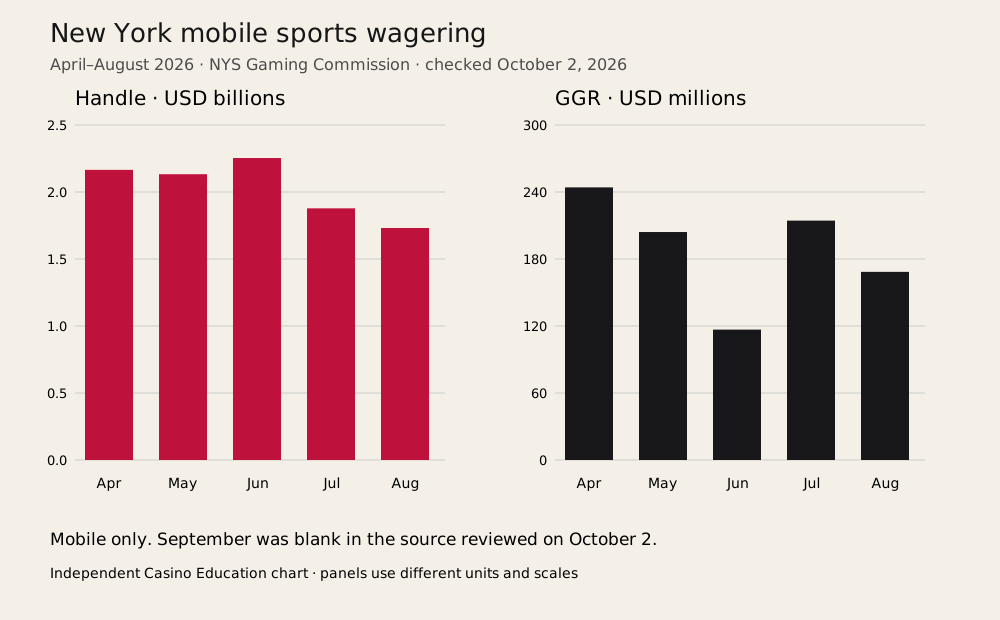
Latest populated months in the source reviewed
On October 2, 2026, the New York State Gaming Commission's statewide monthly mobile sports wagering report contained April through August figures for fiscal year 2026/2027. September's row was blank. We show the five populated months and treat the blank as unavailable, not zero. These data concern mobile sports wagering, not the entire New York gambling market.
| Month | Handle (USD) | GGR (USD) | Calculated GGR / handle |
|---|---|---|---|
| 2026-04 | $2,165,201,727 | $244,127,505 | 11.28% |
| 2026-05 | $2,132,772,286 | $204,161,821 | 9.57% |
| 2026-06 | $2,253,568,545 | $116,764,161 | 5.18% |
| 2026-07 | $1,878,017,985 | $214,365,817 | 11.41% |
| 2026-08 | $1,731,302,503 | $168,476,334 | 9.73% |
What the two measures show
Handle measures the amount wagered. GGR is a revenue measure, not a count of players, deposits or bets. The chart puts them in separate zero-based panels: handle uses billions of dollars and GGR uses millions. The panel heights therefore cannot be compared as if they shared a scale. The table supplies the exact dollars behind the graphic.
The percentage column is our calculation: the month's reported GGR divided by reported handle, multiplied by 100. It is an aggregate reporting ratio. It is not the theoretical house edge of a specific game, an individual bettor's expected return or a prediction for the next month.
Accounting and interpretation
The Commission notes that New York sports wagering GGR is reported on a cash basis. Future-event wagers are taxed as current revenue, while payouts for winning wagers are recognised when redeemed. That timing is one reason the aggregate monthly ratio must not be interpreted as a fixed game probability. Revenue to education is also a separate column in the official document; it is not identical to total handle or total GGR.
Limits of this snapshot
Five months do not establish a full fiscal-year result or a causal explanation for changes. A fall in wagering volume and a change in the revenue ratio can occur together. Comparing the same month in another year requires checking the corresponding report and accounting definitions, rather than drawing a seasonal conclusion from adjacent months alone.
The table and chart were independently compiled from the linked official report. The source can be revised after our review. We identify the covered period and check date so a later release can update the series without inventing values for unreported months.
Sources and checks
- New York State Gaming Commission statewide mobile sports wagering monthly report, fiscal 2026/2027 · Checked 2026-10-02
- Official revenue report directory · Checked 2026-10-02